VizChat Official
@vizchatOfficialBoards

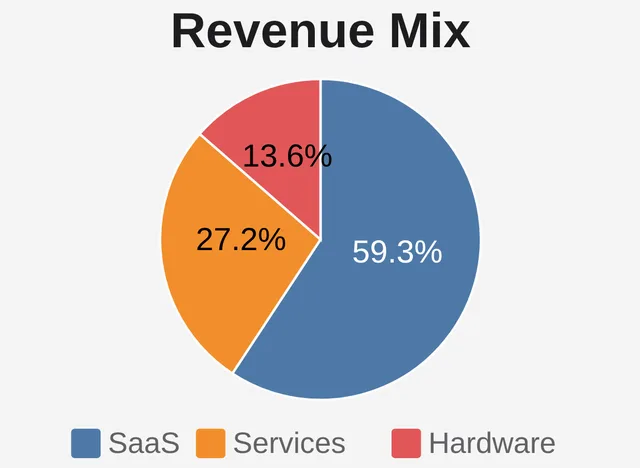
Quarterly business review: revenue trends, structural breakdown, and conclusion page. Charts grow progressively with the presentation, continuing the same visual across slides.

Product roadshow: large text, minimal words, one focus per page, accompanied by a roadmap and zoom-in shots.

Conceptual lecture slides: A line-by-line comparison of function graphs and code, suitable for technical sharing and teaching.
Widgets
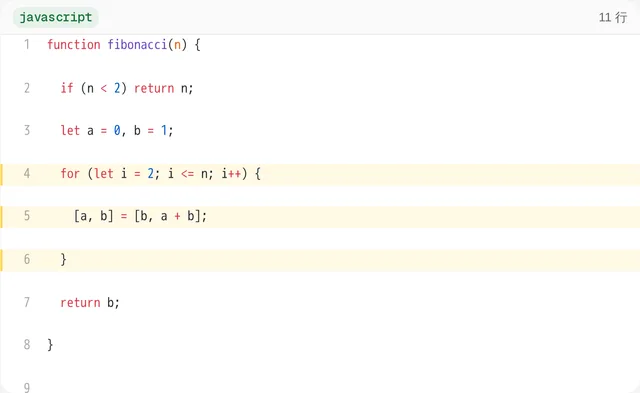
Present code snippets with syntax highlighting, line numbers, and highlighted line ranges for teaching and demos.
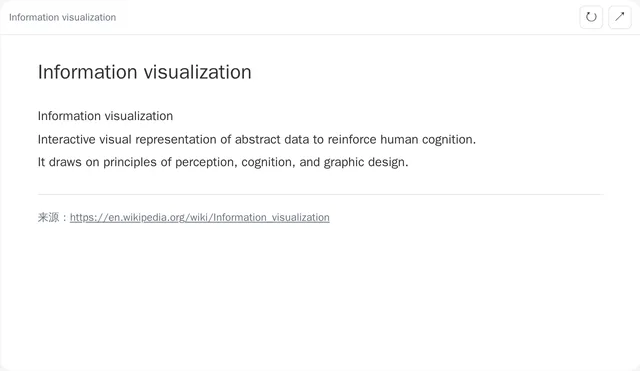
Show the readable text of any web page beside your analysis, with keyword highlighting and a link to the source.
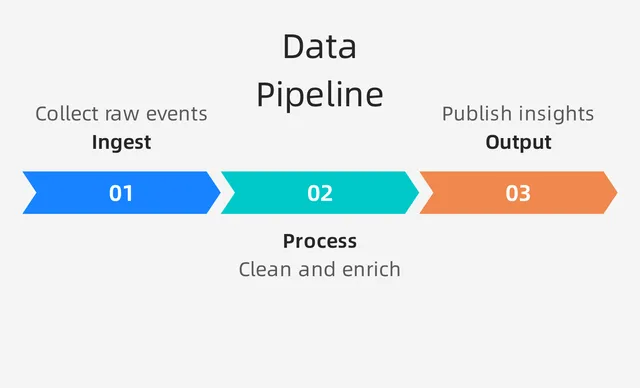
Turn key points into designed infographics — 200+ layout templates for lists, steps, comparisons and stats.

Show a PDF from your workspace or the web, jump to pages, and spotlight exact regions on a page.

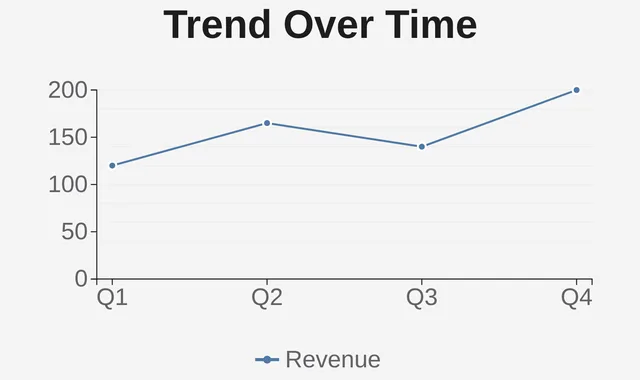
Follow trends across time with multi-series lines, smooth or stepped curves, and editable data points.
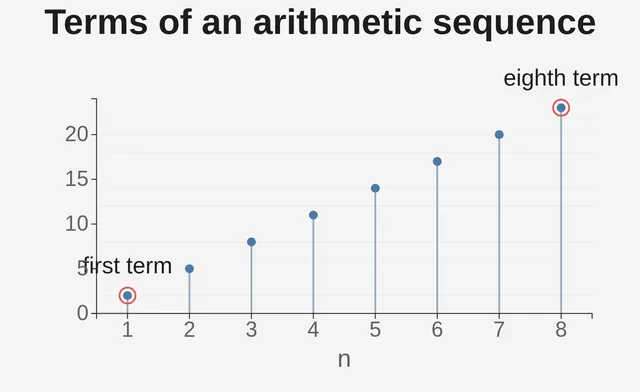
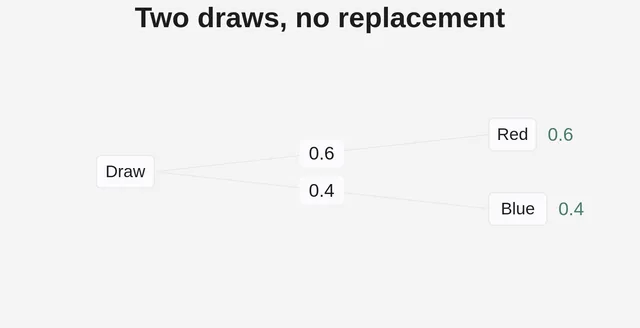
Draw a probability tree: put the chance on every branch and read the odds of each outcome off the end of its path.
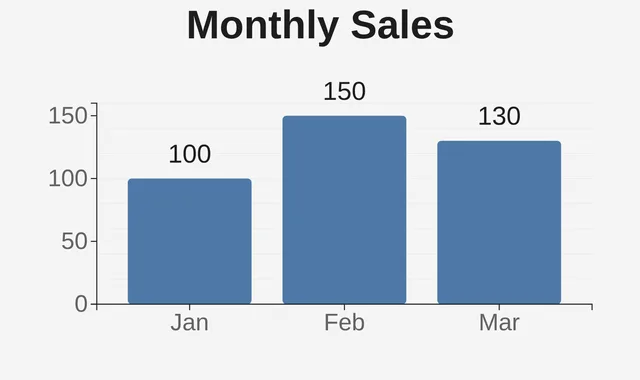

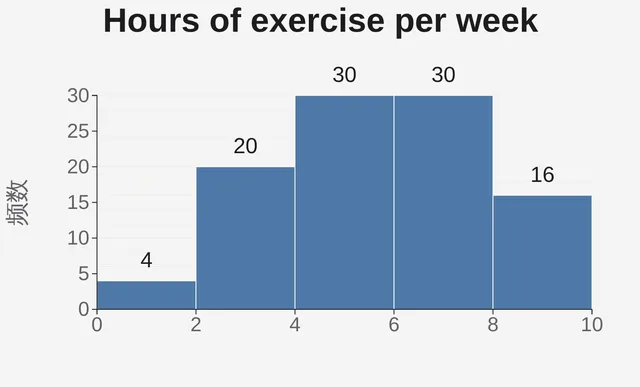
Three ways to picture one batch of numbers: a histogram of classes, box plots side by side, or a stem and leaf plot.

Embed an HTML page from your workspace and spotlight any section with scroll and highlight.
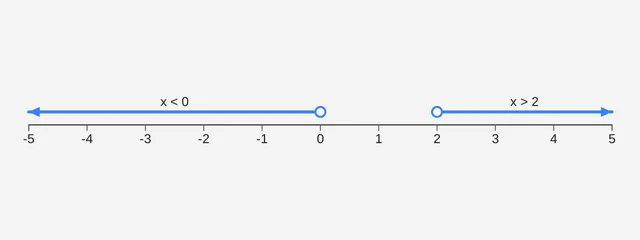
Show values and solution sets on a number line — solid or hollow points, open or closed intervals, arrows for infinity.
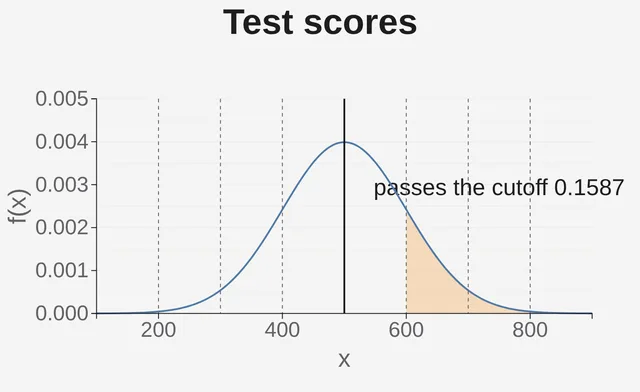
Draw a normal, binomial or listed distribution, shade the stretch you are asking about, and read the probability straight off it.
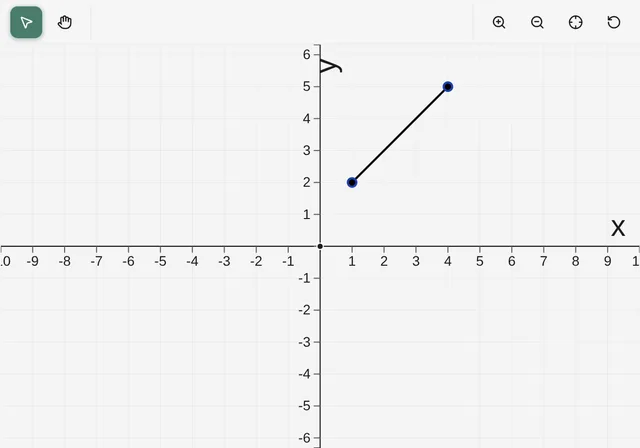
Draw points, lines, circles, polygons, curves, regions, angles, intervals and live measurements on a Cartesian or complex plane.
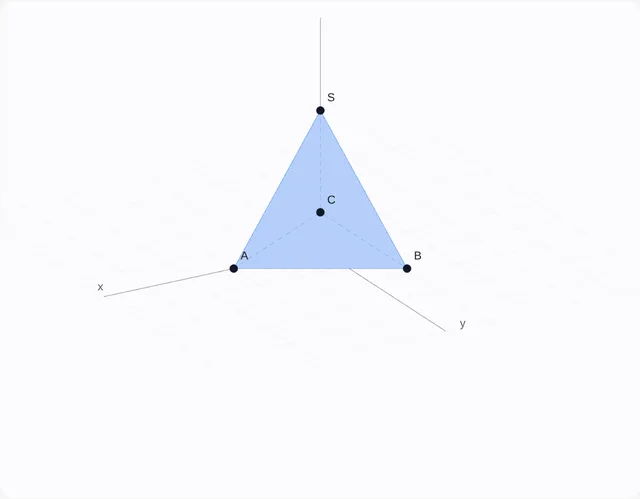

A full-bleed title or section cover — eyebrow, headline and subtitle over a gradient or solid background, revealed in stages.